If you aren’t already aware, NetSuite is a leading cloud-based enterprise resource planning platform (ERP). An ERP allows companies that have outgrown their accounting software to scale and to start integrating planning, purchasing, sales, marketing, finance, and human resources into the same system.
A pivot report is a matrix-based report that has subtotals across both rows and columns and allows us to summarize a much larger dataset.
Creating a Pivot Report Using a Saved Search in NetSuite can be done fairly quickly after the beta bundle is installed.
Step 1: Installing the Pivot Reports BETA Bundle
When you edit a Saved Search or view the results of a Saved Search and don’t see a Pivot Report button, you need to install it.
- Go to Customization > SuiteBundler > Search & Install Bundles
- Click Advanced.
- Fill in the following: Keywords = 17447, Location = Production Account
- Click Search
- Click on the name “Pivot Reports BETA”.
- Click on the Install button.
- Click “Ok” to the confirmation message that appears.
- Click “Install Bundle”.
- Once it’s successfully installed go to
Congrats you have successfully installed the Pivot Reports BETA bundle!
Step 2: Create Your Saved Search
Don’t worry, creating a Saved Search can usually be done fairly quickly especially if all of the data is on one object.
If you already have a Saved Search you want to use, you can skip this step and just open it otherwise we’ll need to create one.
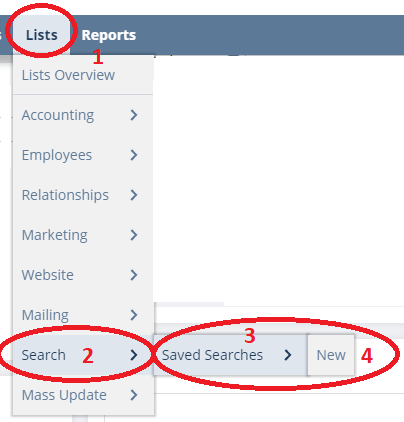
- Assuming, you’re in the Classic Centre (“Admin”). Go to Lists
- Go to Search
- Go to Saved Searches
- Click “New”.
You’ll need to create your saved search based of the object you need.
Step 3: Preview the Saved Search
Now, we need to preview the Saved Search to make sure that it has all of the data that we need.
Click the “Preview” button and confirm it meets our needs.
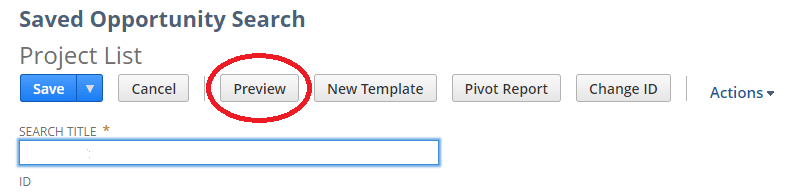
If it meets your needs, that’s great. Click the “Return to Criteria” button and then we can get started on the “Pivot Report”.
Step 4: Creating the Pivot Report
Things are moving along now!
- Now press the “Pivot Report” button.
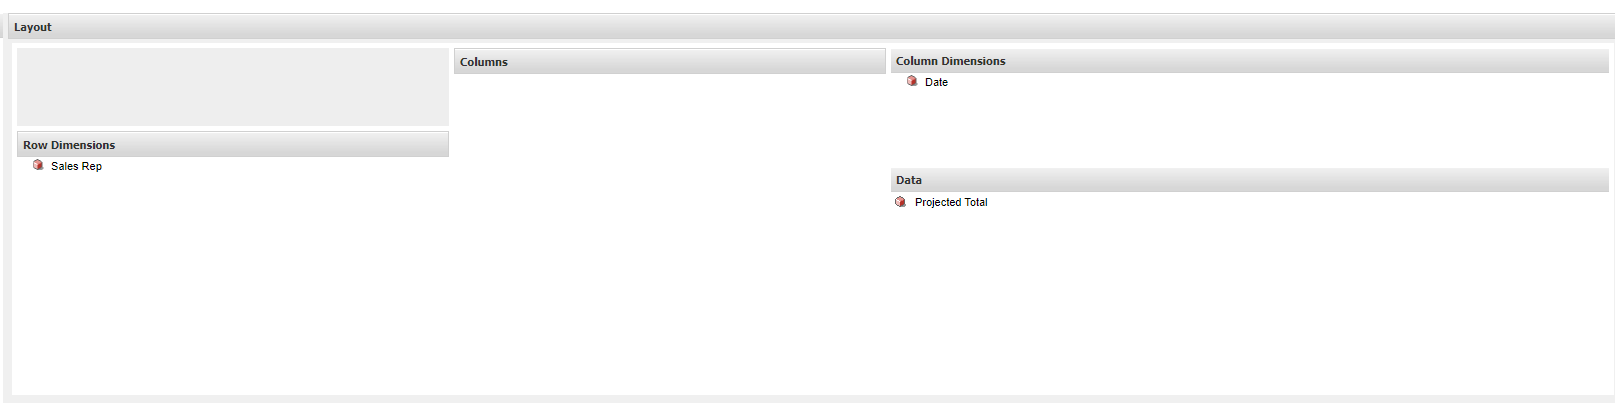
- Begin dragging and dropping fields to where you like them.
- Note: the Preview pane at the bottom of the screen will update as we add and remove fields.
- Row Dimensions are what we will be grouping by. Ie: for an Opportunity Forecast we probably would want to use the Sales Rep.
- Column dimensions provide the columns in the pivot table.
- Data: values under the Column Dimensions
Wrapping it Up
In this blog post, we’ve went through how to create a Pivot Report and how to use it. Pivot Reports are a great way of quickly gaining insights from a large volume of data.

